

Sarolta engineering case study / Windows desktop
GPU Test Station.
Controlled GPU validation for the shop floor.
A local-first Windows application for detecting physical GPUs, running controlled benchmarks, and validating display outputs with deterministic webcam-based ShapeMarker recognition.
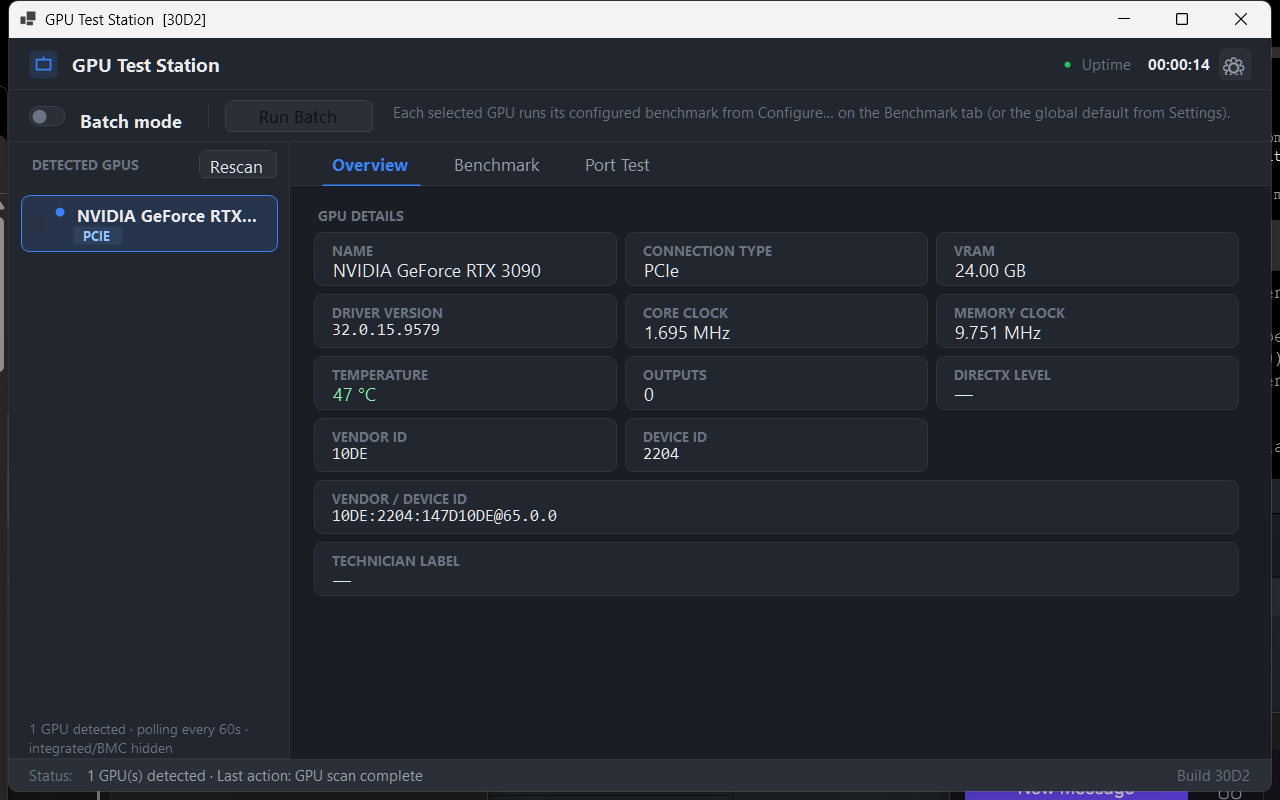
The engineering brief
One desktop application for detection, controlled benchmarking, display mapping, and physical port validation.
What Sarolta built Windows APIs, vendor GPU APIs, controlled benchmark targeting, webcam vision, and UUID-bound local evidence in one technician workflow.
GPU Test Station identifies physical NVIDIA and AMD GPUs, monitors, PCI placement, and GPU-to-display relationships. It runs controlled benchmark sessions, keeps local history, and records port-test evidence against the physical GPU UUID.
This is not only a software test. Technicians connect every GPU output to one monitor in grid or PiP mode; the application displays a different ShapeMarker on each output and captures the physical monitor through a webcam.
Detect
Combine Windows, display, and vendor APIs to resolve physical cards and displays.
Target
Resolve the selected physical card to the correct benchmark-device binding.
Benchmark
Run selected cards serially; persist results and refresh the dashboard after each GPU completes.
Physically verify
Show a distinct marker on every output, capture the monitor by webcam, and retain per-port evidence with the GPU.
Immediate outcome
More cards tested. Less time on the bench.
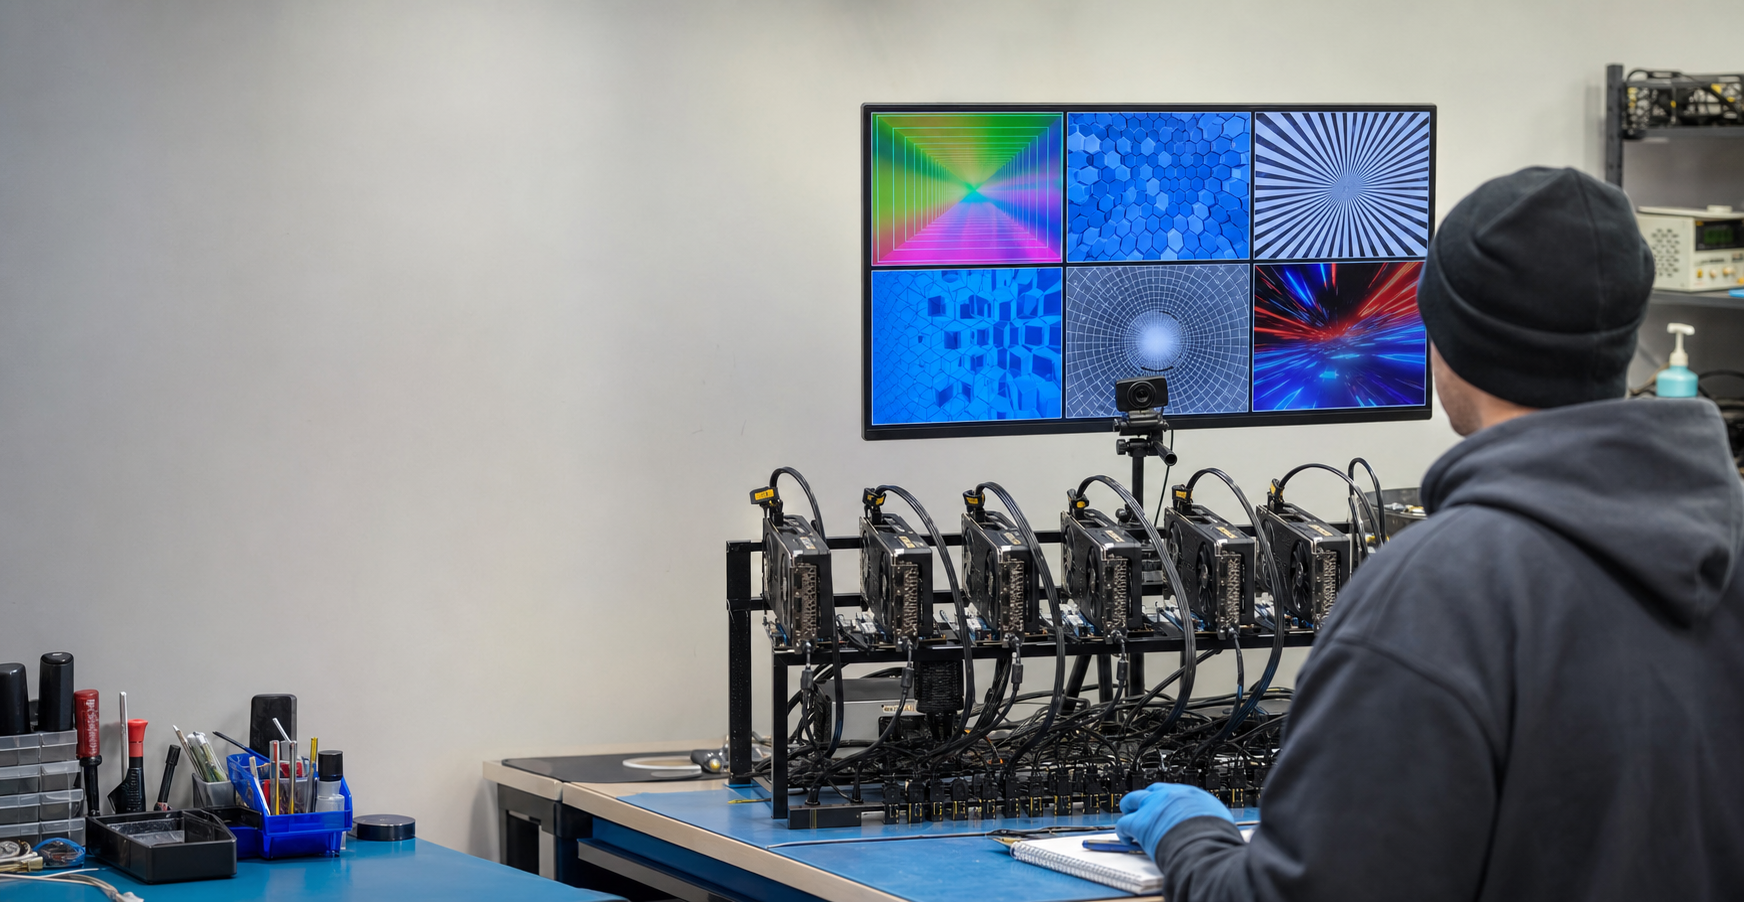
1 GPU / 30 min
Previous validation pace for a technician.
6 GPUs / ~20 min
Observed workflow on one testing bench.
20–30 GPUs per hour across one technician’s workflow.
- Launch once. Open GPU Test Station and select Run batch.
- Move to the next machine. Set up or tear down the next two to four multi-GPU systems while the batch runs.
- Keep the evidence automatically. GPU identity, benchmark results, and reports are stored without repeated operator setup.
- Verify physical ports only when needed. The webcam-based visual port test remains an optional confirmation step.
- Scale next. The planned next phase increases the number of GPUs each test machine can bench and validate.
Software design
AI-assisted delivery.
No AI runtime.
Sarolta used AI-assisted coding alongside a test-driven development process to build the application. The shipped Windows product uses deterministic software only: no AI model, training, inference, or external AI service is required for technicians to use it.
The operating model
From hardware discovery to UUID-bound evidence.
Detection reconciles multiple sources
Multiple Windows and vendor APIs mitigate driver- and vendor-specific gaps, and preserve distinct identities for identical cards.
The benchmark tool is targeted explicitly
The orchestrator binds each selected physical card to the correct benchmark device, then runs the serial batch safely.
ShapeMarkers use deterministic computer vision
Predefined 2×2 patterns, OpenCV contour detection, perspective correction, illumination normalization, and template matching produce the same result for the same image and thresholds.
Reports and captures remain with the GPU
SQLite stores runs; every completed benchmark creates a dated PDF and PNG report, with available port evidence.
Technology stack
A pragmatic desktop architecture with clear responsibilities.
WinForms UI calls application services and orchestrators, which coordinate detection, benchmarking, and port-test modules. SQLite and local runtime artifacts sit below them; Windows APIs, vendor APIs, external executables, and the webcam sit at the edge.
Benchmark integration
Standard benchmarking tools give each card industry-recognised results that technicians and downstream reviewers can readily reference and understand.
Operational reliability
Single-instance guard, global exception handling, startup diagnostics, rolling logs, and generated build identifiers.
The engineering surface
Keep GPU identity, benchmark results, reports, and physical validation in one local workflow.
The batch dashboard is the main working surface. Supporting views show the per-GPU report and webcam confirmation used to test physical display outputs—not merely the application’s own screen rendering.
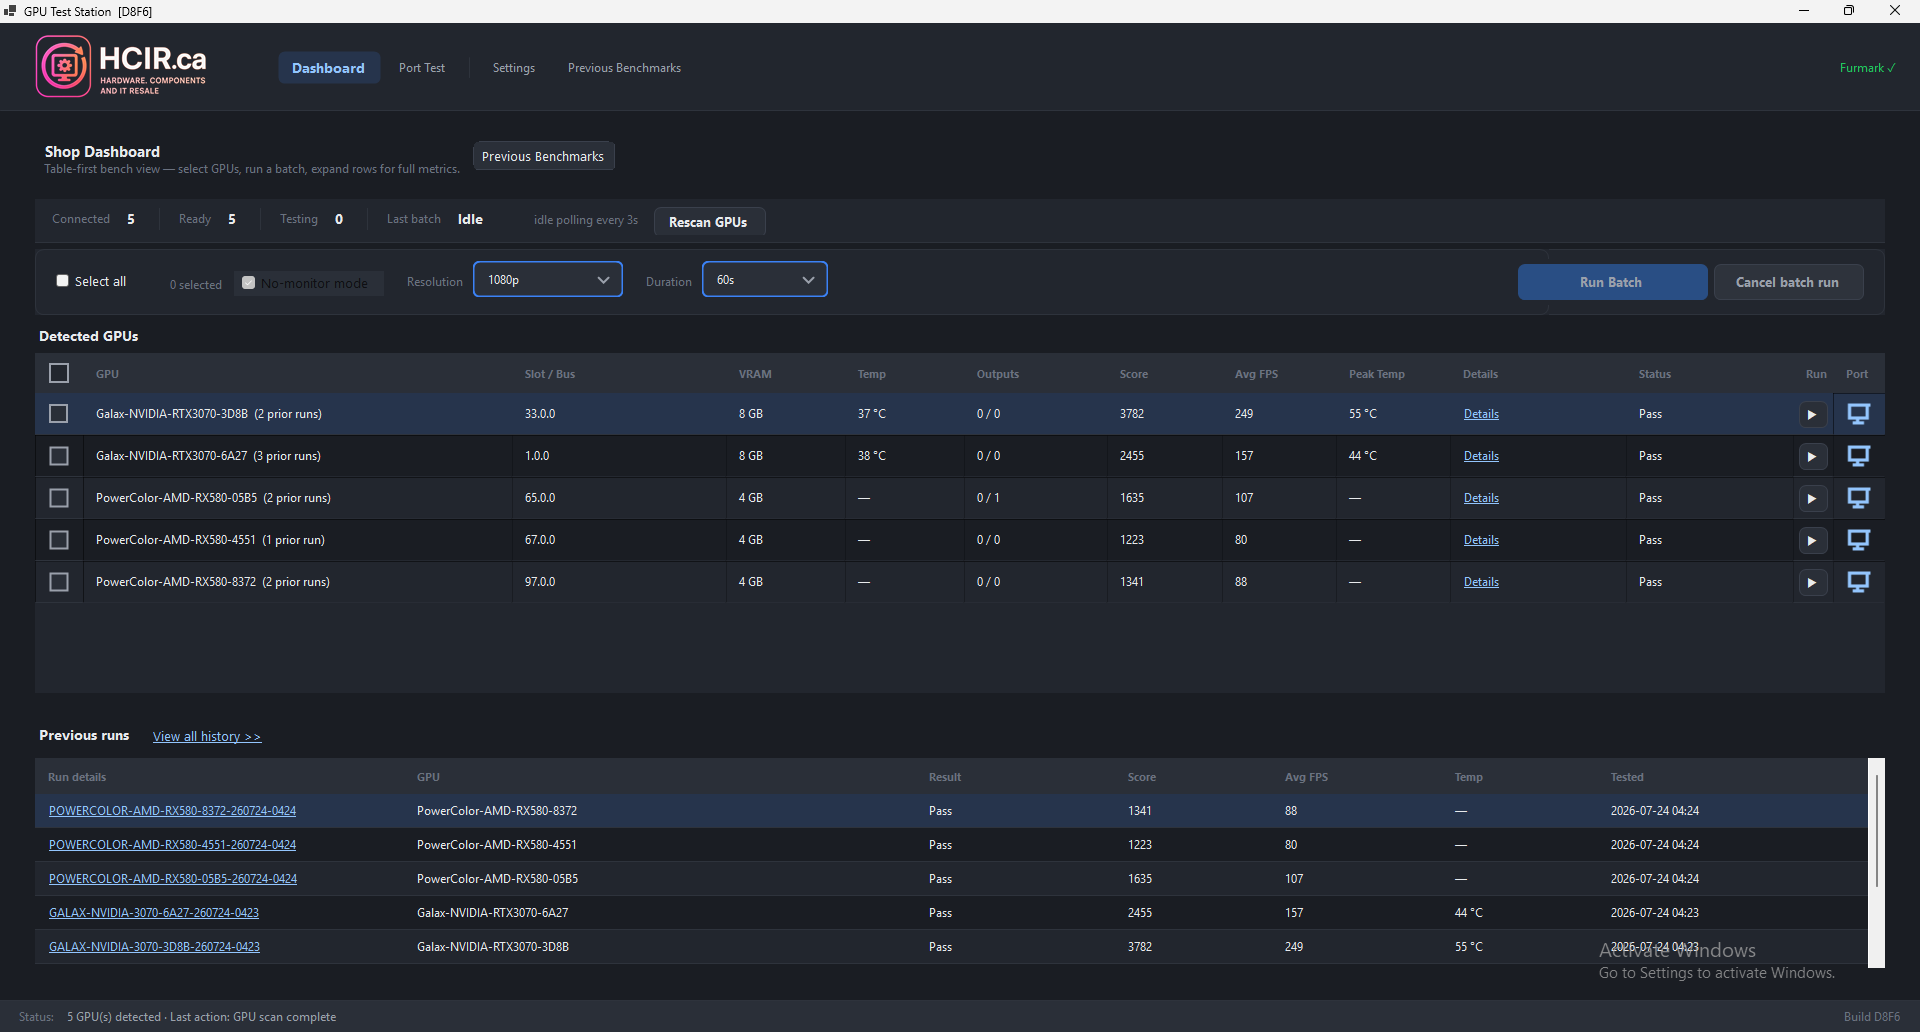
Batch dashboard
Physical GPU state, selected cards, serial batch controls, and recent benchmark activity.
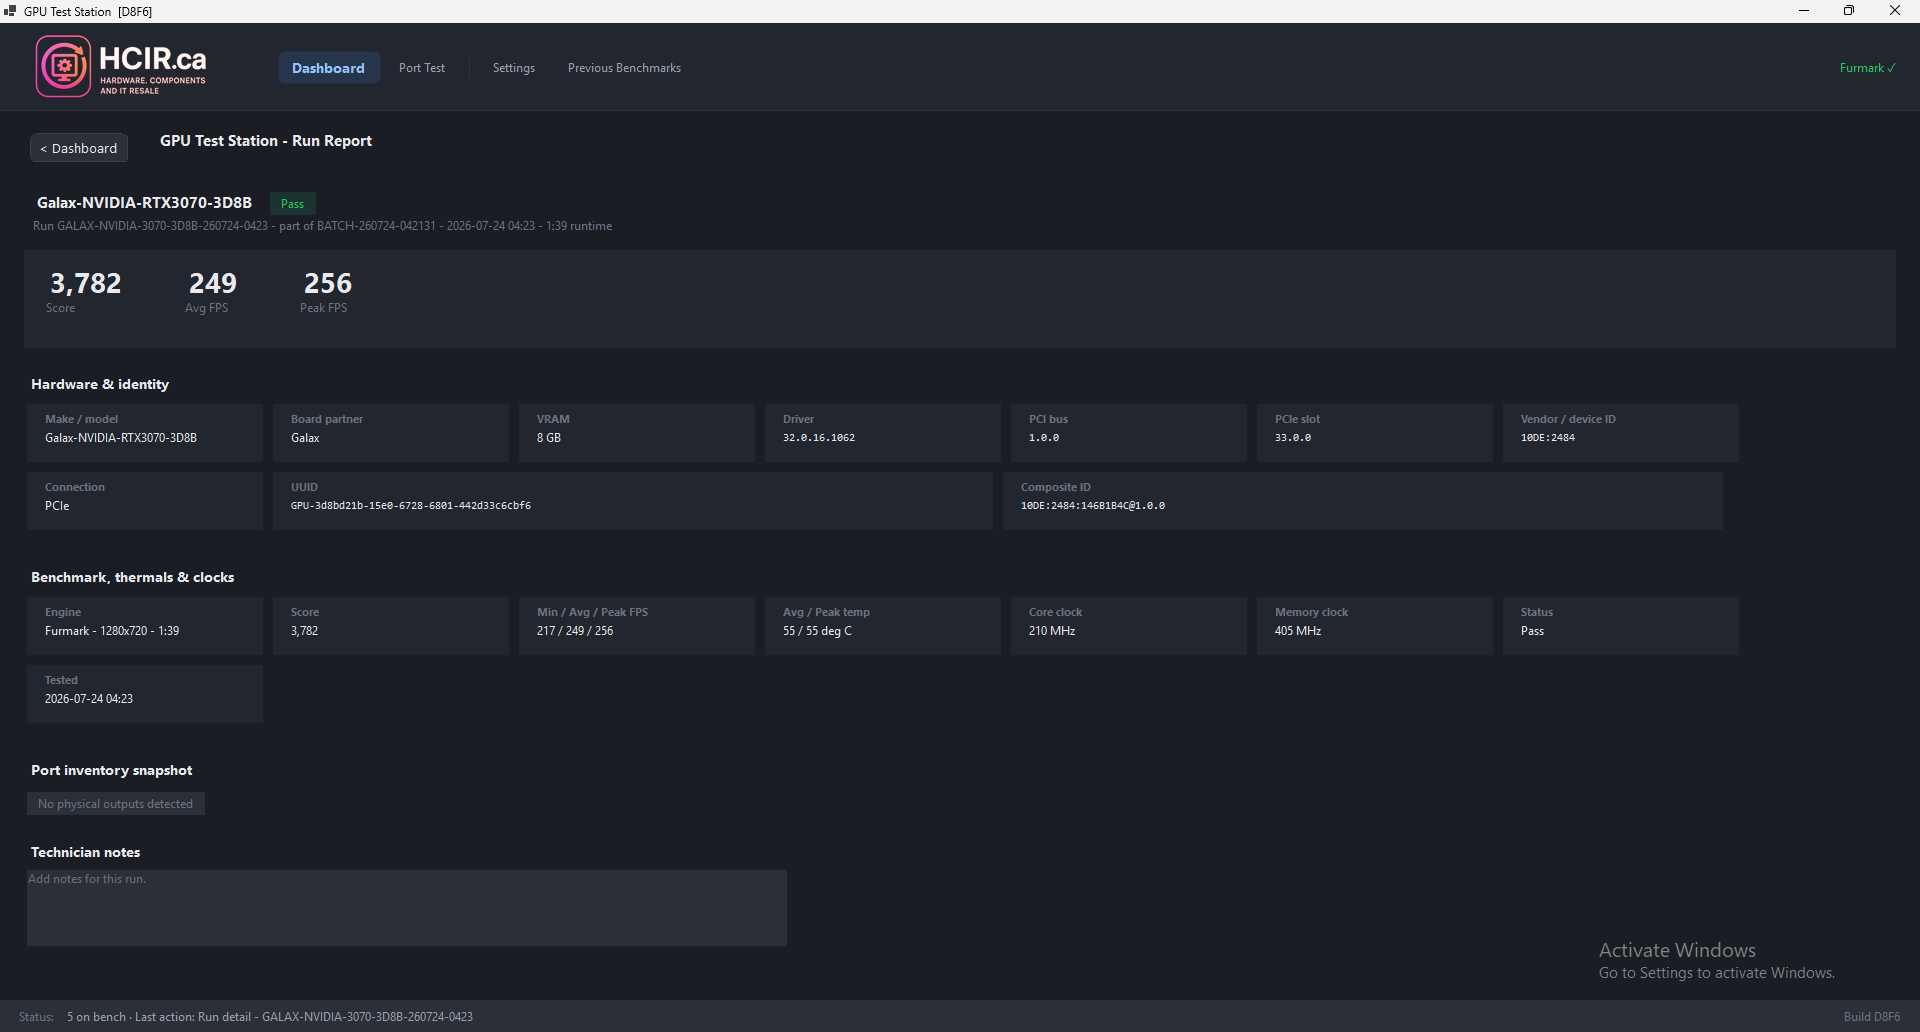
Per-GPU report
Benchmark score, frame rate, thermal data, physical GPU identity, and completion state.
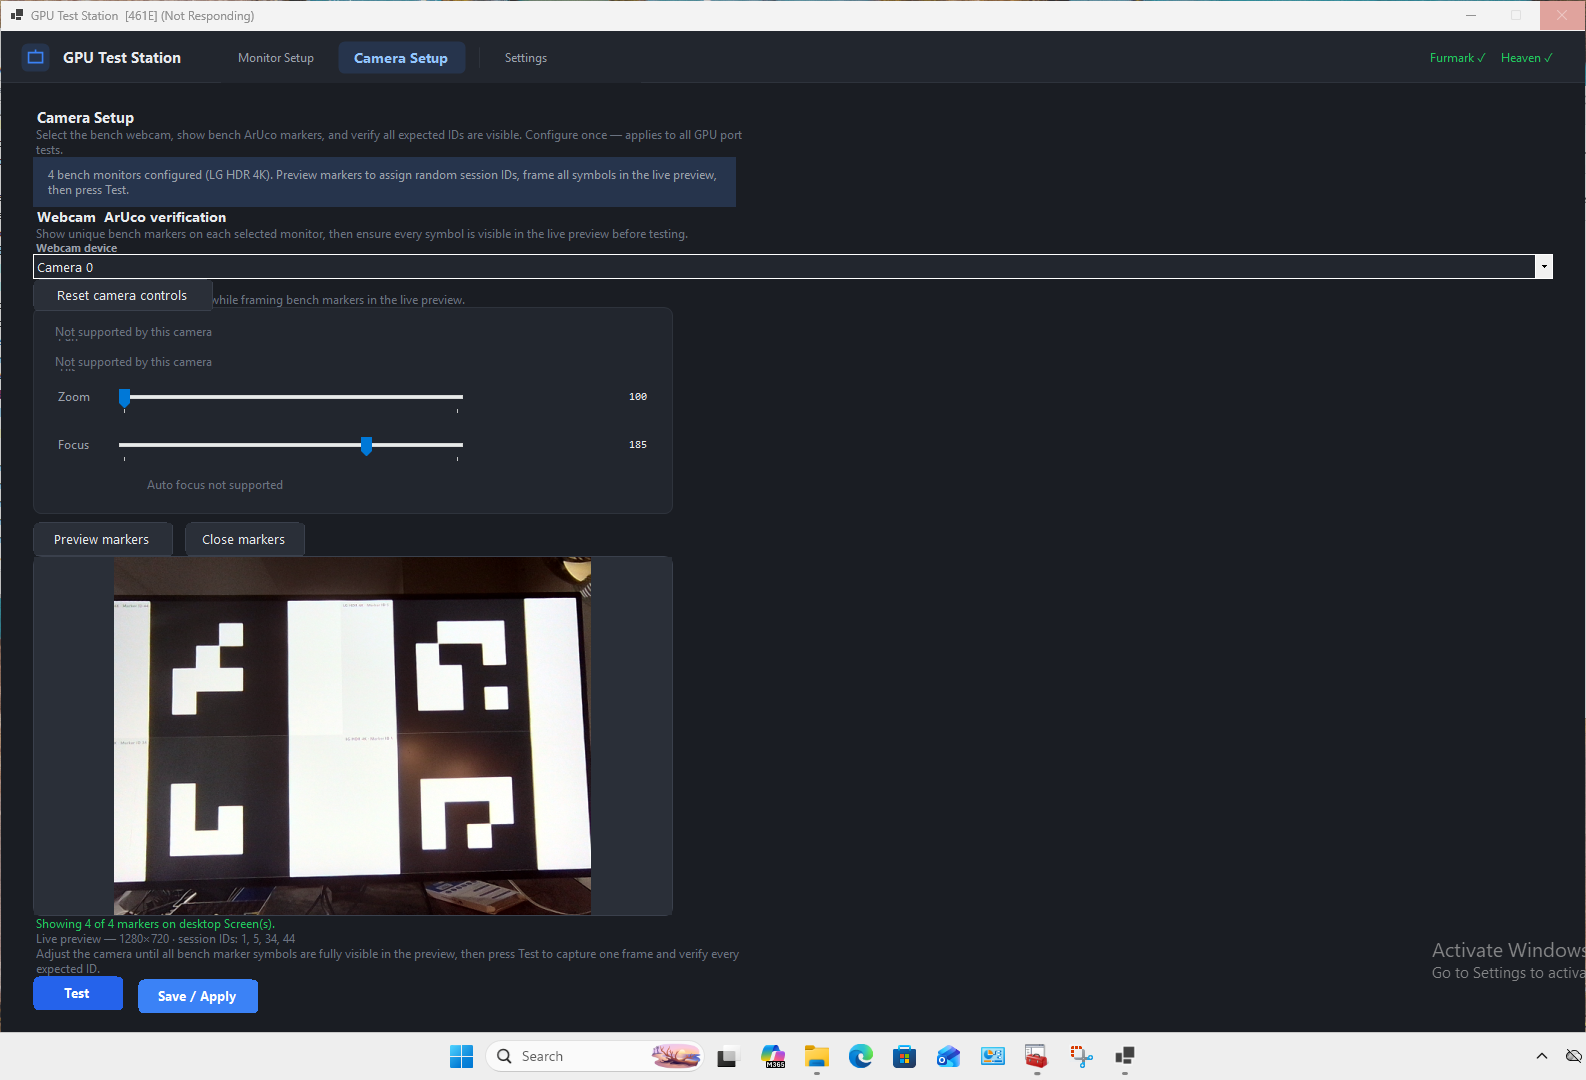
Webcam ShapeMarker confirmation
Each output shows a distinct pattern; a webcam captures the physical display and stores evidence against the GPU.
Shipped and in production
A production desktop application with practical release and recovery paths.
GPU Test Station is shipped to production as a self-contained Windows x64 application. Requirements, specifications, mockups, architecture, deployment instructions, benchmark behaviour, and troubleshooting documentation are maintained in the project; validation and releases are operator-driven rather than CI/CD-managed.
xUnit
Unit and integration-style tests cover lifecycle safety, migrations, display mapping, port tests, and UI behaviour.
Build code
A four-character code is written into BUILD.txt with every production release artifact for traceability.
Win-x64
A self-contained publish folder is deployed as a complete folder or ZIP, without a runtime prerequisite.
Role / focus
Desktop architecture grounded in hardware diagnostics.
- Architecture and C# desktop development
WinForms UI, services, domain modules, local storage, and runtime diagnostics. - Hardware integration and benchmark automation
GPU, display, camera, benchmark engine, and vendor API orchestration. - Production delivery and support
Self-contained production publishes, traceable build codes, logs, startup diagnostics, rollback folders, and field troubleshooting.